Usability testing is one of the most common user-centric activities UX Researchers conduct. It can be either Qualitative or Quantitative.
Qualitative usability testing is usually a small-sample, formative, user-centric activity, aiming to discover and fix usability issues. In other words, the aim is to understand which aspects of the design work well and which do not.
The outcome of such a study takes the form of:
- usability issue descriptions
- severity rating for the observed issues
- and design recommendations.
The most known rule
When we plan recruitment for discovering usability problems, testing with five users is the most known rule. This rule derives from a study that Nielsen and Launderer conducted. (Nielsen & Launderer 1993)
It indicates that:
- With 5 users you can observe 85% of the usability problems that have a probability of occurrence greater than 31% per user
- With 15 users you can observe almost all usability problems that have a probability of occurrence greater than 31% per user
The value of 31% refers to the average problem occurrence (p) and is often overlooked or not known. It means that 31% – 100% of users may encounter a usability issue at least once during a session. Please note that this value might differ for your study. (Sauro & Lewis 2016, Raluca Budiu 2021)
What does it mean
Even though the rule of five is well known, industry experts debate on the matter. Many state that testing with five or even eight users is not enough. (Spool & Schroeder 2001, Perfetti and Landesman 2001, Faulkner 2003)
After analyzing 24 studies, Sauro indicates that the rule of 5 is likely close for business applications. But testing with 8 users is not enough for websites and consumer software.
Communicate to your stakeholders that the more usable your interface becomes, the less the probability of problem occurrence. The less the probability of problem occurrence is, the more users you will need to uncover 85% of the usability problems.
What Neilsen pinpoints is that, if you have the budget to test with 15 users you should not spend it all in one study. You should rather test with 5 users to uncover the most common issues users face. Then, fix those issues in the redesign phase and test the redesign with 5 more users, and so forth.
In context
Putting the above in further context, after testing the original design with 5 users, you will observe 85% of usability issues that have a probability of occurring 31% per user. Then you should try to fix those issues in a redesign phase.
When you conduct a second session on the redesign with 5 more users, you will observe most of the 15% of the remaining usability issues of the original design that were not discovered during the first round.
At the same time, you will validate if the fixes you introduced worked and if there are any usability issues those fixes introduced. (Nielsen 2000)
Adjust to your needs
But what happens if you want to observe a higher or lower % than the 85% Nielsen proposes? What if you want to detect problems that have an occurrence probability higher or lower than 31%?
Collaborate with your stakeholders to:
- Decide the percentage of minimum problem occurrence probability (p).
- Decide how likely you would like to be in detecting the problem P(x≥1).
- Calculate the total number of users required by
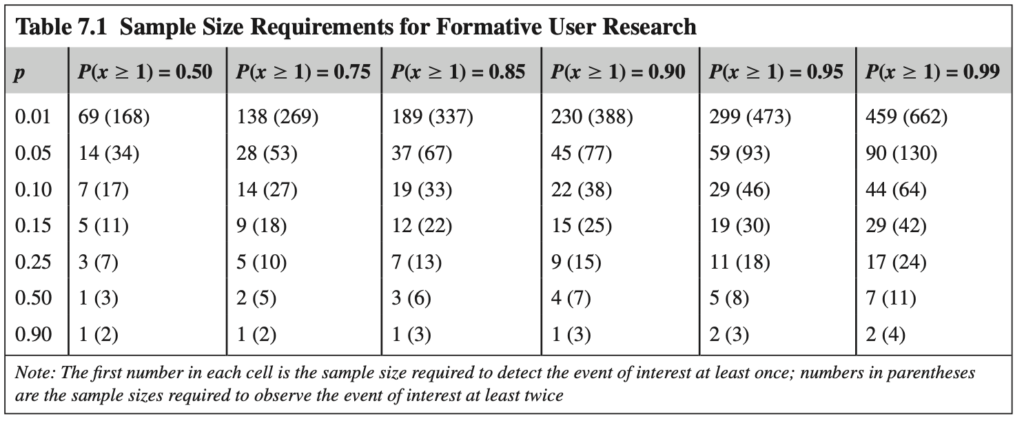
- Either using the table below that Sauro and Lewis (2016 p146) provide and shows the sample size as a function of:
- The problem occurrence probability (p)
- The likelihood of detecting a problem at least once P(x≥1).
- Or by using this formula: n = ln(1-P(x≥1)) / ln(1-p)
- Either using the table below that Sauro and Lewis (2016 p146) provide and shows the sample size as a function of:
Example 1:
Imagine that you agreed with your stakeholder that you would like to be able to observe 90% of the issues (P(x≥1) = 90%) that have a probability of occurrence of 0.15 (p = 0.15). How many users should you recruit?
Using the table, with 15 users you will observe 90% of the problems that have a probability of occurrence 15% during a single session.
Using the formula: n = ln(1-0.9) / ln(1-0.15)
n = 14.1 (at least a total of 14.1 users which rounds up to 15)
You can divide those users equally in each iteration and include 5 users per iteration. Or you can start with a few users and increase them in each iteration. (i.e iteration A -> 3 users, iteration B -> 5 users, and iteration C -> 7 users)
Example 2:
How many users should you test with, so you can observe 75% of the problems (P(x≥1) = 75%) that have a probability of occurrence of 25% (p=0.25) in a single session?
Using the table, with 5 users you will observe 75% of the problems that have a probability of occurrence 25% during a single session.
Using the formula: n = ln(1-0.75) / ln(1-0.25)
n = 4.8 (at least a total of 4.8 users which rounds up to 5)
Note: If you fix the observed usability problems and conduct a second session with 5 more users, you will observe most of the 25% of the remaining usability issues of the original design that were not discovered during the first session. At the same time, you will observe 75% of the problems introduced by the changes made between iterations 1 & 2 that affect 25%-100% of the users. Thus validating if you have or if have not fixed the issues observed during the first iteration.
Example 3:
If you want to observe 75% (P(x≥1) = 75%) of the problems that are slightly harder to occur (p=0.15) in a single session, how many users should you recruit?
Using the table, with 9 users we will observe 75% of such problems that have a probability of occurrence 15% during a single session
Placing the numbers in the formula: n = ln(1-0.75) / ln(1-0.15)
n = 8.5 (at least a total of 8.5 users which rounds up to 9)
We recommend recruiting 8 – 12 users per iteration (to cater for more than 1 user profile), with at least four (4) users for each distinct user profile.
- With 8 users you observe 73% of the issues that have a probability mean of occurring during a session of 15% – 100%.
- With 12 users you observe 85% of the issues that have a probability mean of occurring during a session of 15% – 100%.
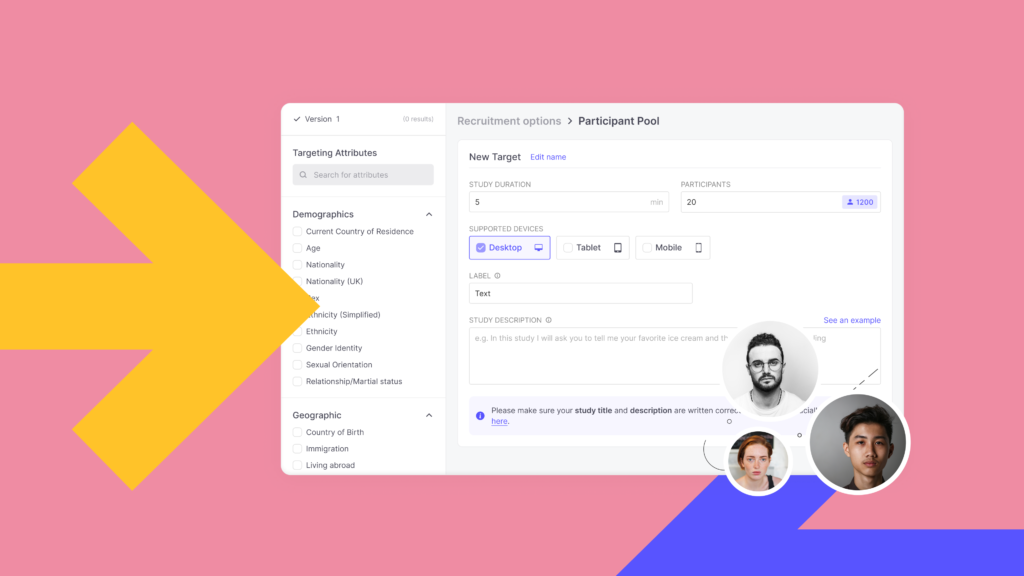
Useberry offers a vetted and verified participant pool.
- Recruit users from 34 countries around the world.
- Profiled on hundreds of attributes, to match even the most niche and demanding testing needs.
- Recruit as many representative users as you need to answer your research questions.
- Get results with no delays.