We’re excited to introduce the latest Open & Closed Card Sorting updates that give you more control over your studies by introducing new setup options and enable you to analyze in-depth your results by providing you with more views.
As part of our ongoing effort to make Useberry’s user experience better for you, we continuously introduce brand-new features and functions that help you uncover product insights even more effortlessly. Stay tuned!
Open & Closed Card Sorting – Setup Improvements
Card Οptions
- Add cards in bulk
- Enter the title of each card, separated by a comma.
- Add tooltip description
- This option allows the researcher to set a description of the card that could help participants better understand what this card means.
- Add image on cards
- This option allows the researcher to add an image to the cards. The participant will see the card along with the image and the card title.
- Hide card title labels
- This option allows the researcher to remove the title from the cards. This option is available only when the “Add image on cards” option is enabled. The participant will see the card along with the image but without the card title/name.
- Randomize cards
- You can enable this option to display the cards to the participants in random order in order to reduce the bias of the study.
- Require participants to rank cards
- Enabling this option will display a number on each card indicating its position within the category it has been sorted into. It is Useful if you want to analyze the order in which your participants sorted the cards.
- The total number of cards to sort and the total number of unsorted cards are always shown to the participant
- This displays a progress indicator to your participants, showing the number of cards left to be sorted and the total number of cards on the list.
Categories Οptions (Available Οnly for Closed Card Sorts)
- Add tooltip description
- This option allows the researcher to set a description of the category that helps participants better understand what this category means.
- Add category card limit
- Enabling this option allows the researcher to set a limit for the number of cards participants can sort into categories. It’s ideal for using categories to prioritize cards.
- If the number in the “Card limit” field is 0, the card will have no limit.
- The participants will be allowed to add as many cards in a category as the number you set in the “Card limit” field.
- Randomize categories
- This option allows the researcher to display the categories in a randomized order, which helps to reduce the bias of the study.
- Add categories in bulk
- Enter the title of each category, separated by a comma.
Closed Card Sorting – Results Improvements
Our updated Card Sorting results make it easier to draw meaningful conclusions and present findings to stakeholders.
1. Cards
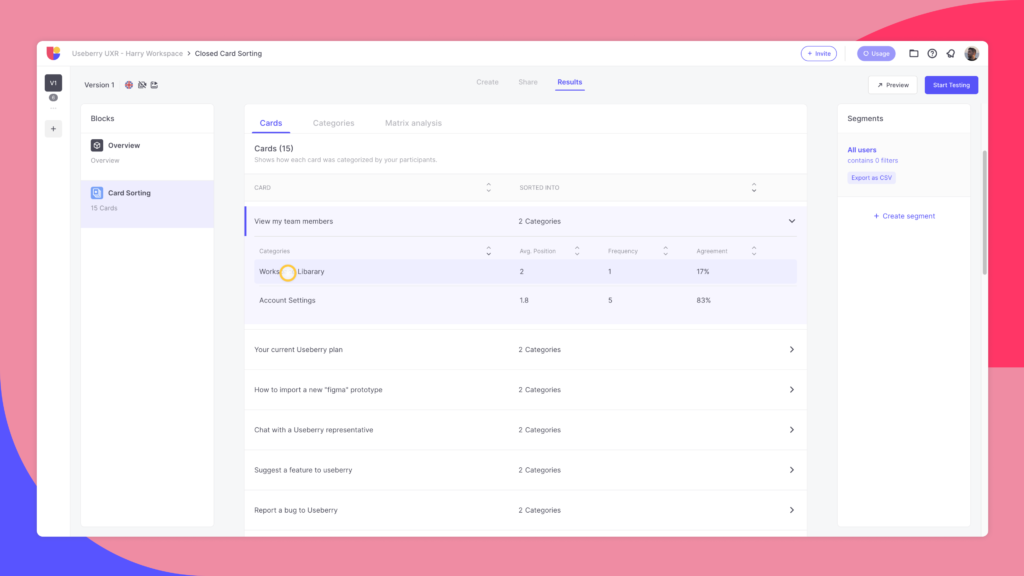
Explore how cards were categorized by your participants, and understand how they interpreted each card. Within this view:
- Quickly identify which cards were divided across different categories and which ones were grouped into the same categories most frequently.
- Sort each column of this view in ascending or descending order.
- It reveals the areas of agreement and disagreement among your participants as well as any unclear card labels.
2. Categories
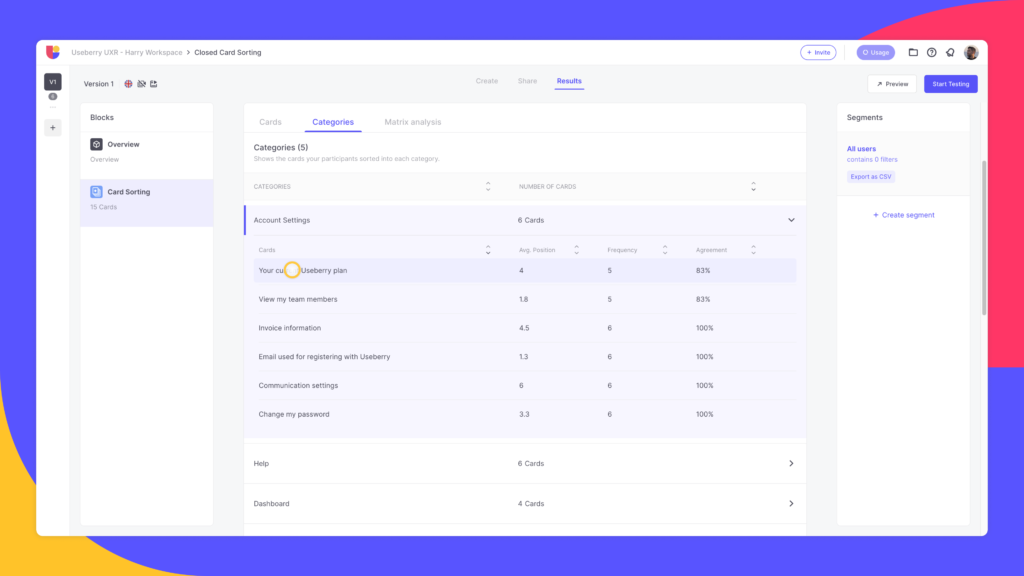
Explore which cards participants sorted into each category.
- See the list of categories along with the number of cards that were placed in each category.
- You can now sort each column of this view in ascending or descending order.
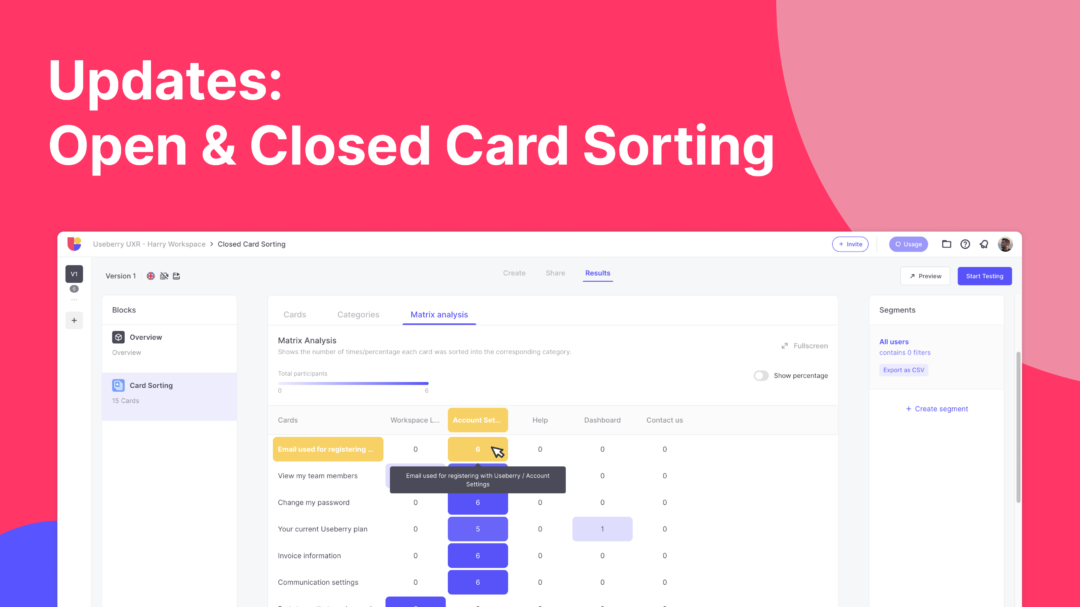
3. Matrix Analysis
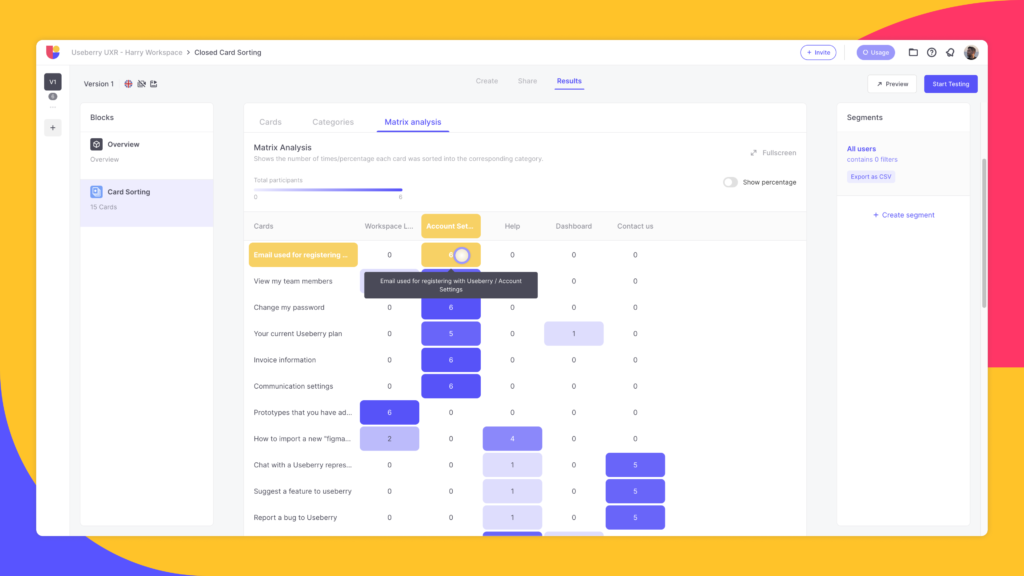
See the number of times each card was sorted into your pre-set categories and explore the most popular placement for each card.
- The number inside each cell where a card and a category intersect represents the number of participants who sorted that card into that category.
- Open the “Show percentage” switcher to view the % instead of the counts.
- A darker shade of blue indicates a higher number of participants.
Open Card Sorting – Results Improvements
1. Cards
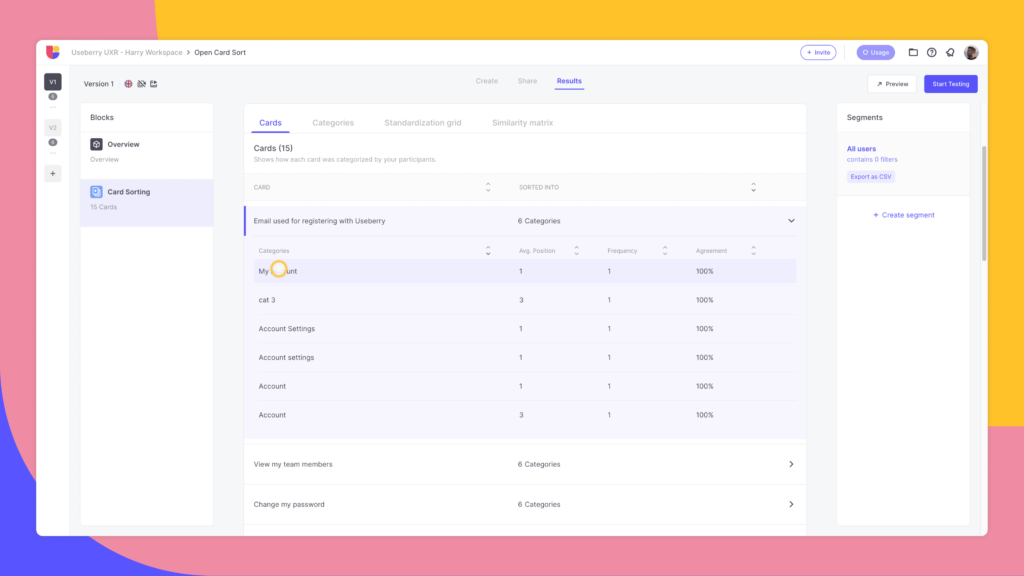
Explore how cards were categorized by your participants, and understand how they interpreted each of them.
- Quickly identify which cards were divided across different categories and which ones were grouped into the same categories most frequently.
- Sort each column of this view in ascending or descending order.
- It reveals the areas of agreement and disagreement among your participants as well as any unclear card labels.
- If you standardize categories (as we will see below in Categories) the cards view will update its data taking into consideration the standardization you have made.
2. Categories
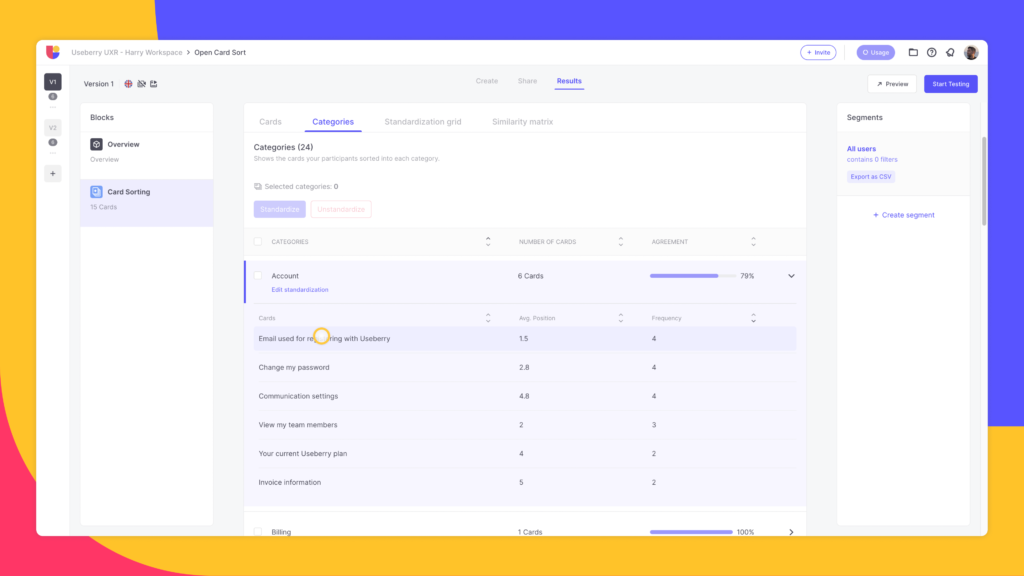
With this view, you can explore the categories that participants created, how they named them, and which cards they sorted into each category.
- Discover the terminology/wording your participants used and see if they included common cards in similarly named categories.
- To make your data easier to examine, standardize the categories where participants have sorted similar cards together and named the categories alike.
- Standardize two or more categories into one by selecting the categories and clicking the “Standardize” button. Once you do this you can see the “Agreement rate” of this standardization (a higher % is most optimal).
- The Cards view will reflect this standardization automatically.
3. Standardization Grid
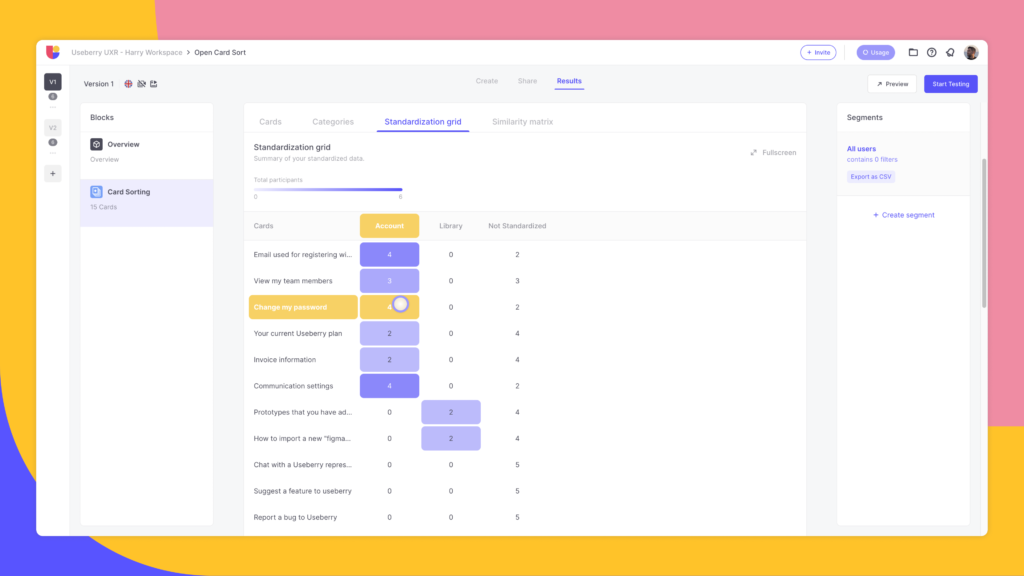
This view shows a synopsis of your standardized data by presenting the placement of cards across the different standardized categories.
- Each table cell shows the number of times a card was sorted into the corresponding standardized category.
- The darker color shade of the cell means that more participants agreed with this grouping.
4. Similarity Matrix
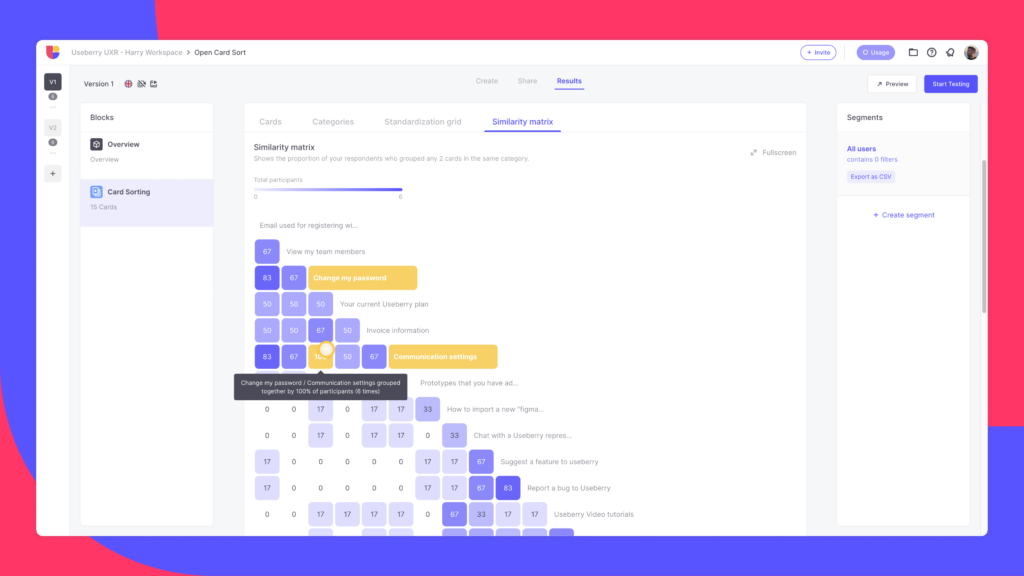
This view displays the percentage of your respondents who grouped any 2 cards in the same category.
- The intersecting cell for each pair of cards indicates the proportion of users who grouped these cards together.
- The darker color shade of the cell means that more participants placed this pair of cards together. Darker clusters can help guide you in identifying potential groupings.
Watch here the demonstration of all our Card Sorting updates.
Ready to create your Card Sorting study?
We’d love to know your experience with Useberry and we will be excited to hear your thoughts and ideas.