A few weeks ago, I was having a conversation with our Senior UX Researcher, Harry Karanatsios, for a different project. He shared something that stuck with me: “Research doesn’t have to be perfect to be valuable. Early in my career, I focused too much on perfecting methodologies and overanalyzing data. With time, I’ve learned that sometimes, quick-and-dirty research can be just as impactful.” That thought perfectly sums up what we set out to do with our recent social media polls. We weren’t running a large-scale study, but we were still able to gather insights that highlight trends in UX research, design, and development.
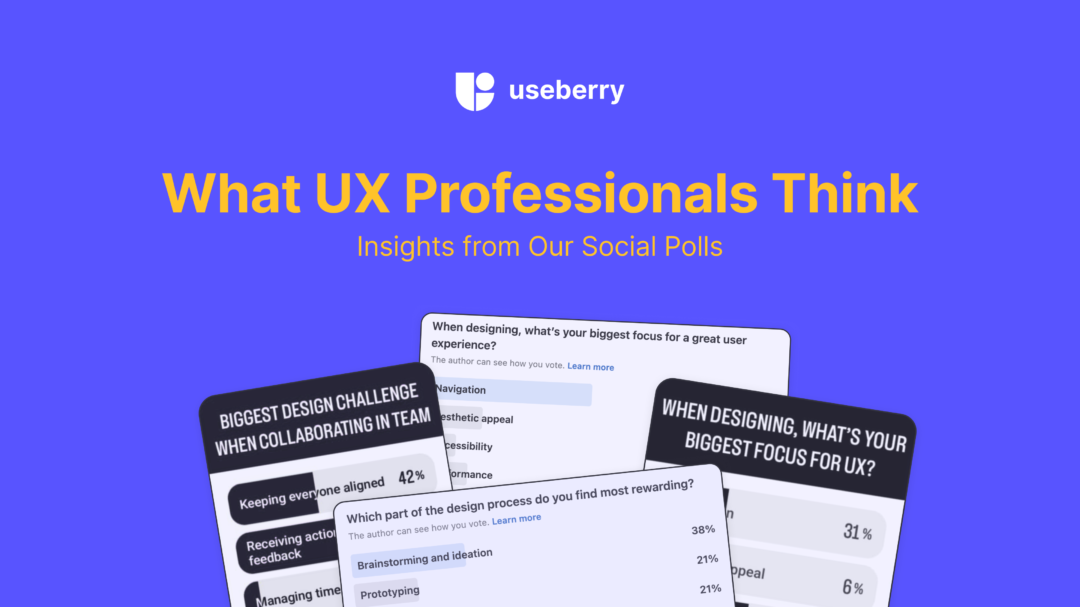
Over the past few weeks, we asked on our LinkedIn and Instagram pages a series of 12 poll questions. Some responses showed clear industry-wide trends, while others revealed surprising differences between platforms. Here’s what we learned from your votes and what it says about the state of UX and product development.
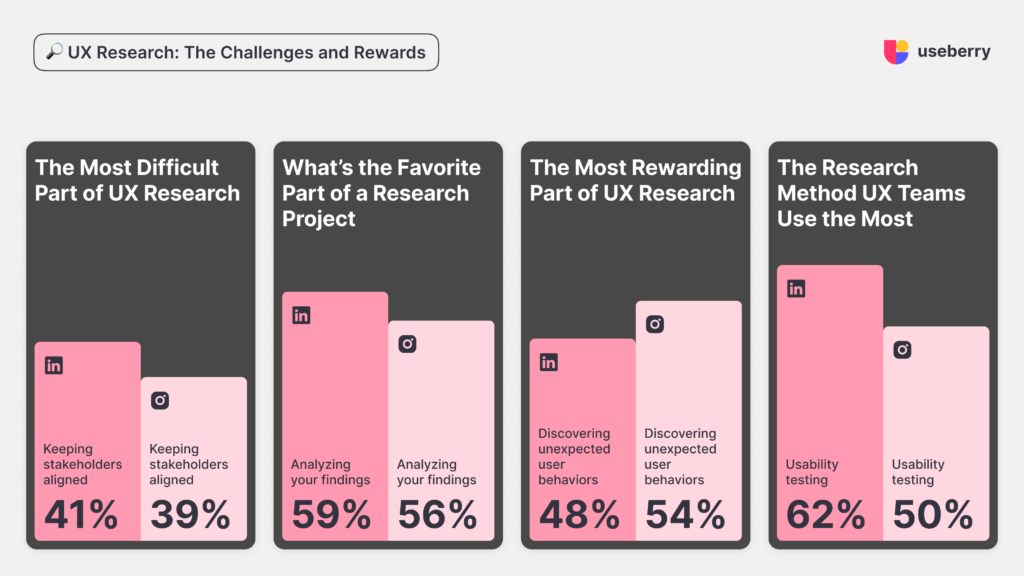
🔎UX Research: The Challenges and Rewards
We asked UX researchers about their biggest challenges, their most rewarding moments, and the research methods they rely on the most. One challenge stood out above all: keeping stakeholders aligned.
The Most Difficult Part of UX Research
Keeping stakeholders aligned was the most common challenge among UX researchers, with over 40% of respondents on both LinkedIn and Instagram selecting this as their biggest pain point. I guess it makes sense, convincing teams to act on research findings can be just as hard as conducting the research itself.
- Keeping stakeholders aligned (LinkedIn: 41%, Instagram: 39%)
- Finding participants (LinkedIn: 18%, Instagram: 27%)
- Presenting insights (LinkedIn: 9%, 18%)
- Analyzing data (LinkedIn: 32%, Instagram: 15%)
This is why, on top of having clear and actionable insights, strong collaboration and transparent communication are key. If stakeholder buy-in is an ongoing struggle, structured reports and research presentations like the Usability Testing Report Template by Useberry can help bring research findings to life.
What’s the Favorite Part of a Research Project
When asked about their favorite part of the research process, analyzing data stood out as the clear winner, with 56% on LinkedIn and 59% on IG. This suggests that while research can have its challenges, UX researchers truly enjoy making sense of the findings and extracting valuable insights.
None of the other choices had a significantly high number of votes:
- Defining objectives (LinkedIn: 14%, Instagram: 19%)
- Structuring the study (Linkedin: 18%, Instagram: 12%)
- Analyzing your findings (Linkedin 59%, Instagram: 56%)
- Presenting the results (Linkedin: 9%, Instagram: 12%)
Data analysis is where the real impact happens, translating raw user feedback into actionable insights! For all UX researchers out there who love uncovering insights but want a more seamless process, check out the solutions Useberry offers!
The Most Rewarding Part of UX Research
UX researchers find the most joy in discovering unexpected user behaviors. Around half of the responses highlighted this as the most satisfying part of their work. Whether it’s uncovering usability issues or seeing users interact with a product in ways no one expected, these moments make research worthwhile!
- Discovering unexpected user behaviors (LinkedIn: 48%, Instagram: 54%)
- Seeing insights improve design (LinkedIn: 28%, Instagram: 29%)
- Collaborating with teams (LinkedIn: 0%, Instagram: 8%)
- Validating design decisions (Linkedin: 24%, Instagram: 8%)
The Research Method UX Teams Use the Most
No surprises here! Usability testing took the top spot, with 62% of LinkedIn users and 50% of Instagram users choosing it as their go-to method. User interviews and questionnaires also had a strong showing, while preference testing ranked the lowest.
- Usability testing (LinkedIn: 62%, Instagram: 50%)
- User interviews (LinkedIn: 31%, Instagram: 46%)
- Questionnaires (LinkedIn: 7%, Instagram: 4%)
- Preference testing (Linkedin: 0%, Instagram: 0%)
These results align with what we see at Useberry. UX Teams need quick, iterative feedback on their designs, and usability testing remains a go-to method for gathering actionable insights.
✍️UX Design: The Motivation Behind Updates and Challenges in Teamwork
Shifting the focus to UX design, we explored what drives design updates, which parts of the process are most rewarding, and what challenges teams face when collaborating.
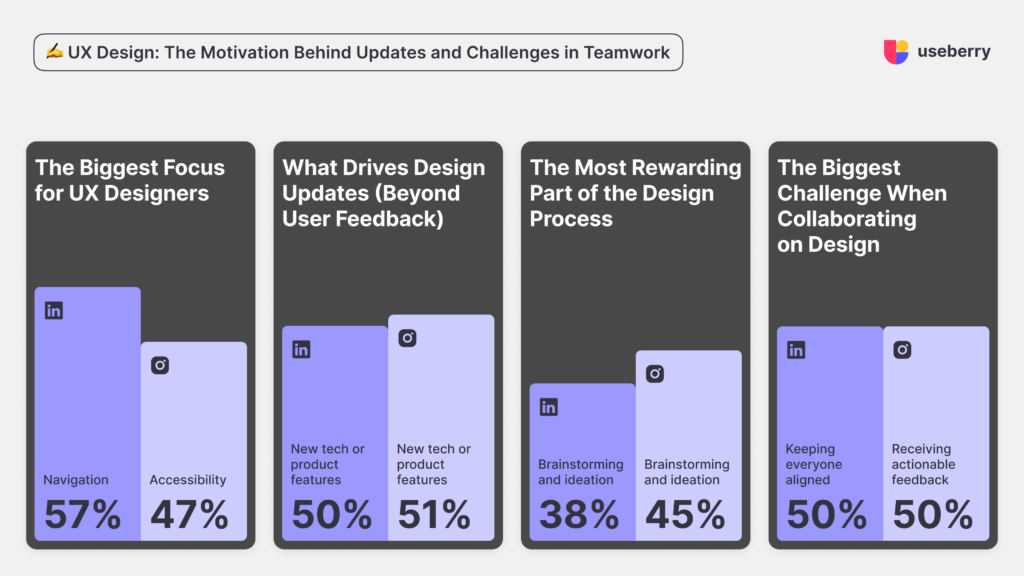
The Biggest Focus for UX Designers
Interestingly, responses varied depending on the platform. On LinkedIn, 57% of respondents said navigation was their top priority, while 47% of Instagram users placed accessibility first.
This split might hint at a difference in how professionals on each platform approach UX. LinkedIn, being more industry-focused, may attract designers thinking about structural usability, while Instagram users may lean toward inclusivity and usability for a broader audience.
- Navigation (Linkedin: 57% , Instagram: 31%)
- Accessibility (Linkedin: 10% , Instagram: 47%)
- Performance (Linkedin: 14% , Instagram: 16%)
- Aesthetic appeal (Linkedin: 19% , Instagram: 6%)
What Drives Design Updates (Beyond User Feedback)
When it comes to making design updates, new technology and product features were the top reasons across both platforms. It seems that industry trends or stakeholder input don’t hold as much sway over design decisions as the push for innovation.
- New tech or product features (LinkedIn: 50%, Instagram: 51%)
- New design trends (LinkedIn: 7%, Instagram: 8%)
- Stakeholder input (Linkedin: 36%, Instagram: 33%)
- Personal initiative (LinkedIn: 7%, Instagram: 8%)
The Most Rewarding Part of the Design Process
Designers love the early-stage ideation and brainstorming process.
- Brainstorming and ideation (LinkedIn: 38% , Instagram: 45%)
- Prototyping (LinkedIn: 21%, Instagram: 14%)
- Seeing the final product (LinkedIn: 21% , Instagram: 28%)
- Improving existing designs (Linkedin: 21% , Instagram: 14%)
The Biggest Challenge When Collaborating on Design
Interestingly, LinkedIn and Instagram had different top challenges. On LinkedIn, the hardest part was keeping everyone aligned. On Instagram, it was receiving actionable feedback. Anyone who has worked on a design team knows the struggle of vague feedback like “Make it pop” which isn’t exactly helpful. Clear UX testing and gathered insights can help teams make feedback more concrete.
- Keeping everyone aligned (LinkedIn: 50%, Instagram: 42%)
- Receiving actionable feedback (Linkedin: 38%, Instagram: 50%)
- Managing timelines (Linkedin: 13% , Instagram: 8%)
- Balancing opposing input (Linkedin: 0%, Instagram: 0%)
⚙️Development: Debugging, Refactoring, and Facing Deadlines
On the development side, we explored debugging habits, motivations for refactoring code, and the biggest development challenges teams face.
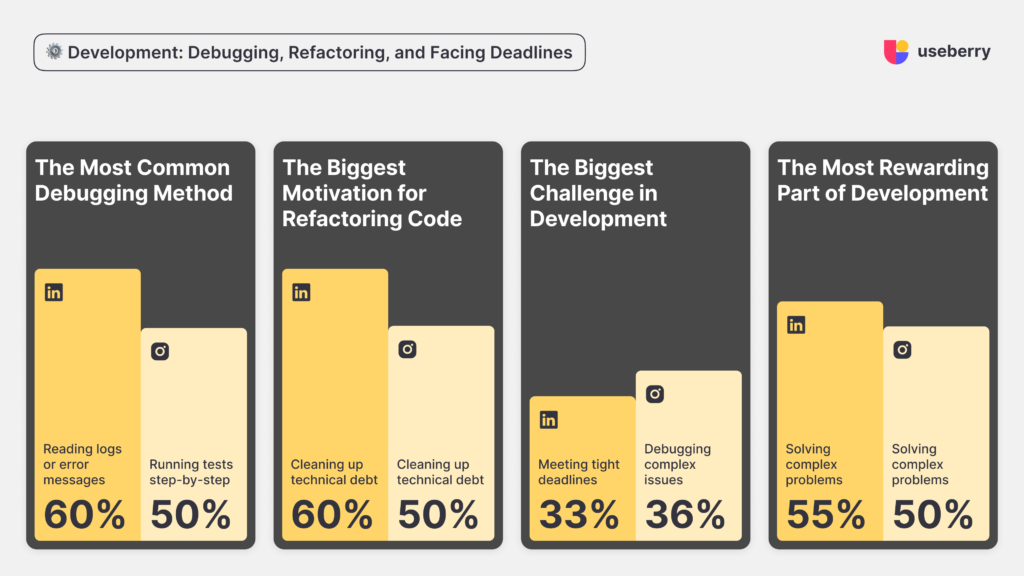
The Most Common Debugging Method
Developers had a split preference for debugging methods depending on the platform. On LinkedIn, they prefer reading logs or error messages (60%), while Instagram users favor running tests step by step (50%). This was one of the biggest discrepancies between the two platforms, hinting at different debugging mindsets across audiences. Maybe that’s a question for a future poll?
- Reading logs or error messages (LinkedIn: 60%, Instagram: 38%)
- Running tests step-by-step (Linkedin: 40%, Instagram: 50%)
- Consulting online communities (LinkedIn: 0%, Instagram:12%)
- Pair programming (LinkedIn: 0% Instagram: 0%)
The Biggest Motivation for Refactoring Code
Across both platforms, the top motivation was clear: cleaning up technical debt.
- Cleaning up technical debt (LinkedIn: 60%, Instagram: 50%)
- Improving performance (LinkedIn: 20%, Instagram: 0%)
- Adopting best practices (LinkedIn: 0%, Instagram: 33%)
- Enhancing scalability (Linkedin: 20%, Instagram: 17%)
The Biggest Challenge in Development
Looks like debugging complex issues and tight deadlines are two of the biggest challenges in development. Interestingly, collaborating with designers was barely voted so maybe those design-dev tensions are just a myth?
- Meeting tight deadlines (LinkedIn: 33%, Instagram 29%)
- Debugging complex issues (LinkedIn: 33%, Instagram: 36%)
- Collaborating with designers (Linkedin: 17%, Instagram: 14%)
- Keeping up with new tech (LinkedIn: 17%, Instagram: 21%)
The Most Rewarding Part of Development
Solving complex problems was the clear winner, with over half of respondents picking it as their favorite part of being a developer on both platforms. That’s not too surprising, writing clean code and solving a tricky bug can be a deeply satisfying process. Solving puzzles and simple mysteries have been a way to relieve stress for generations.
- Solving complex problems (Linkedin: 55%, Instagram: 50%)
- Seeing users enjoy the product (Linkedin: 18%, Instagram: 12%)
- Learning new technologies (Linkedin: 18%, Instagram:38%)
- Launching a new product (Linkedin: 9%, Instagram: 0%)
What’s Next?
This was the end of our first round of polls, and the results were both validating and eye-opening. But we are not stopping here. Our next set of polls have started with questions directly from our own head of UX research, design, and developer, things they are curious to ask to colleagues in the same departments as well as others who they collaborate with.
In the meantime, if keeping stakeholders aligned, gathering quick usability insights, or refining your design process sounds familiar, Useberry is here to help. Test your designs, gather real user feedback, and turn insights into action with ease.
Stay Tuned For The Next Round of UX Polls & Results
If there’s a question you’d love to see answered, let us know!